Reports
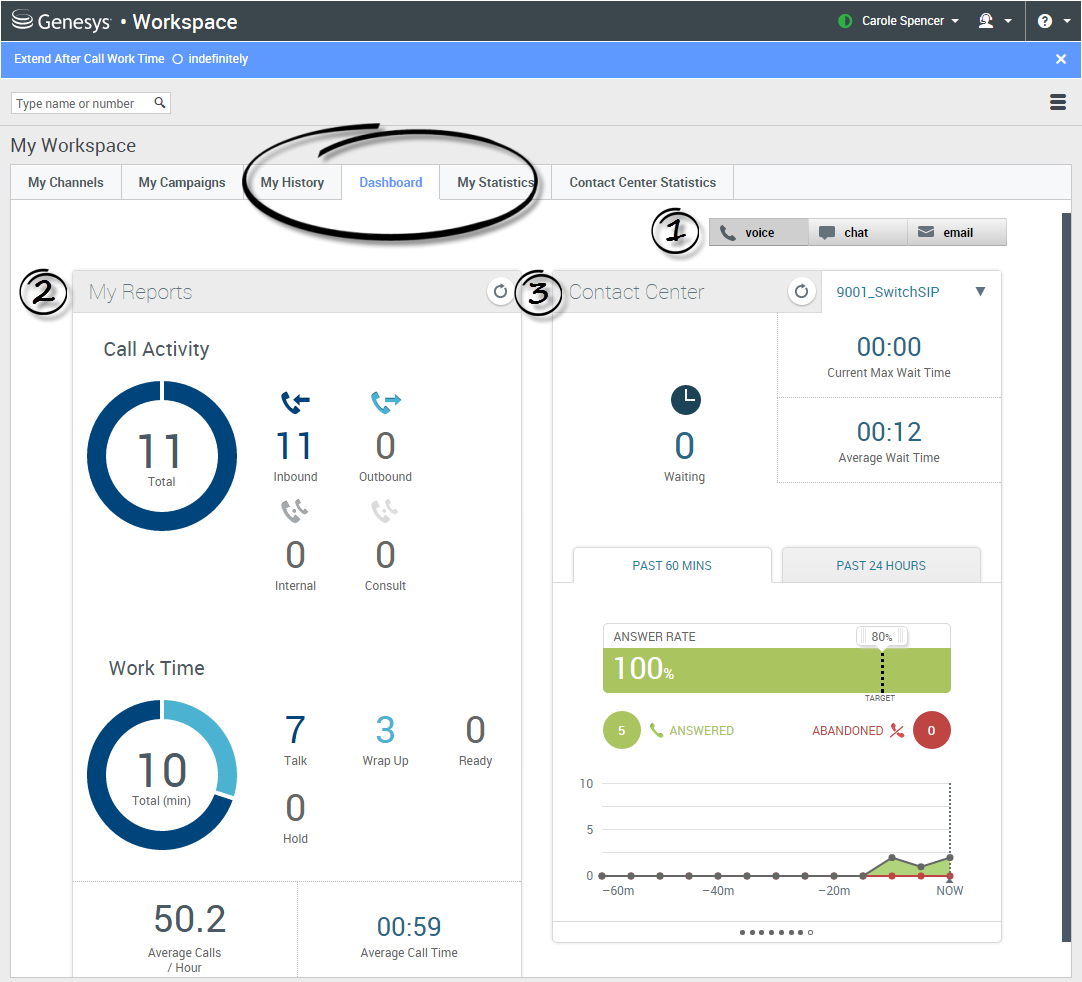
This topic describes how to use the Dashboard tab in Workspace Web Edition to display the My Reports and Contact Center dashboards. These dashboards track your personal statistics and the statistics of your Contact Center. Your administrator might have added other reports too.
Sommaire
How do I access the Dashboard?
Use the Dashboard tab to monitor your own activity and the activity for the entire contact center.
- You can switch between the channels (such as voice, chat, email) to view information related to each channel.
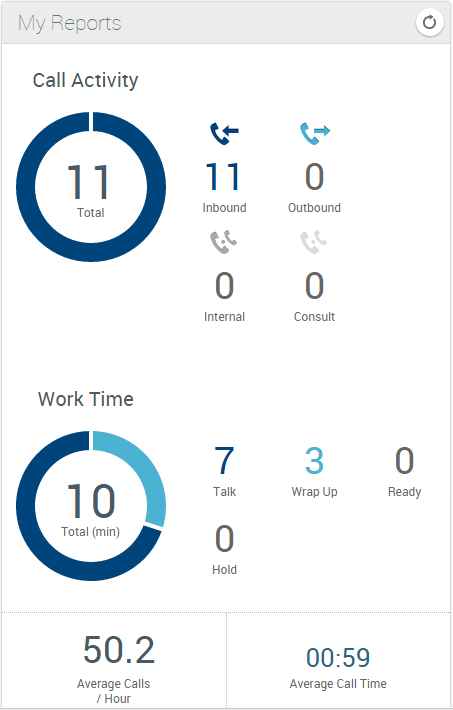
- My Reports displays information about your activity in the selected channel, such as your Call Activity and Work Time.
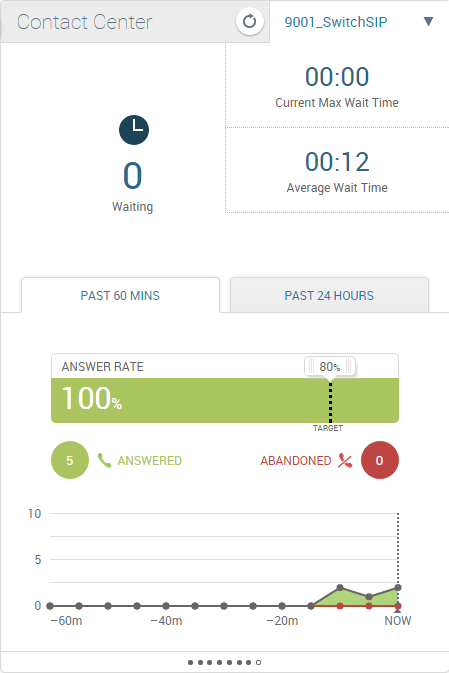
- Contact Center displays information about the selected channel for the entire contact center, such as Wait Times and Answer Rates.
What information can I see under My Reports?
You can view information about how many calls, chats, or emails you have handled since you logged in, and whether or not you are meeting your requirements, under the My Reports area of the Dashboard.
The data for your activities and times will change depending on which channel you select. For example, if you are viewing information for the voice channel:
- Call Activity shows how many calls you've made of each type.
- Work Time shows how many minutes you've worked and spent in various activities, such as talking, doing wrap-ups, being ready, and keeping callers on hold.
Other statistics might also be available, depending on the channel selected and how your administrator has set things up.
What information can I see under Contact Center?
When customers are waiting too long to have their calls, chats, or emails answered, they can become frustrated. The Contact Center area of the Dashboard lets you see the current state of activity in your call center.
For each media channel (and for each switch on the voice channel), you can see how many interactions are waiting to be answered, the average amount of time your customers or contacts are waiting for a response, and the current maximum amount of time contacts are waiting.
For the voice channel, you can also view summary graphs that show the performance of your call center over the past 60 minutes and over the past 24 hours. These graphs show you whether or not you and your fellow agents are meeting your targets.
How do I view my statistics?
The My Statistics tab displays the list of your Key Performance Indicators (KPIs).
You can see your current KPIs and a summary of the KPIs of your work groups. You can use the results to compare your performance with the overall performance of the groups you belong to.
You might see the following performance-related icons in your list:
(Check with your system administrator to find out what the icons mean and how they impact your statistics.)
Note: If a statistic has been configured incorrectly, the background of the statistic becomes red and the error icon is displayed. You should report errors immediately. The reason for the problem is displayed in a tooltip if you place your mouse pointer over the problematic statistic row.
How do I view statistics for my Contact Center?
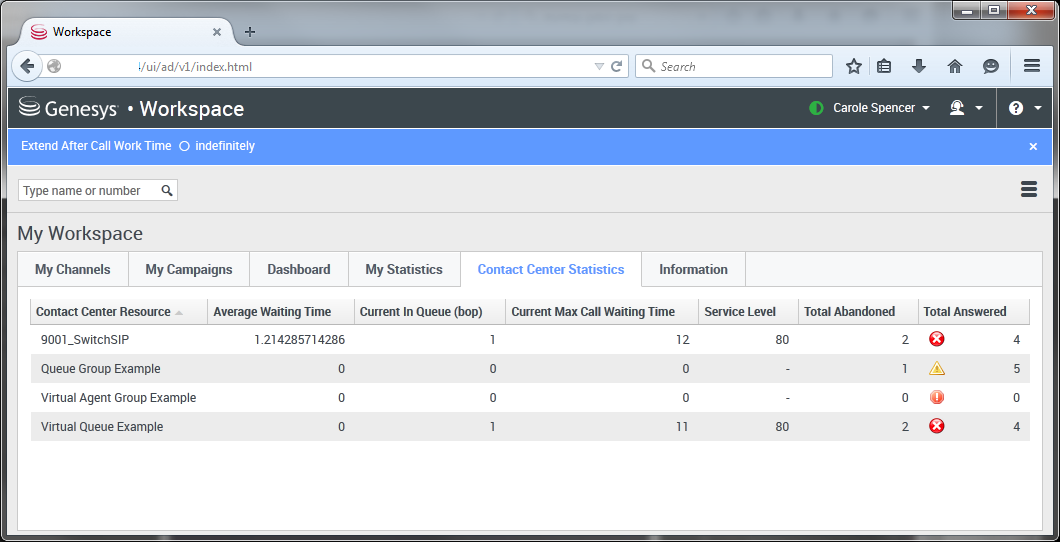
The list of statistics about the Routing Points, Virtual Queues, Queue Groups, and Agent Groups is displayed under Contact Center Statistics.
You can see statistics that summarize the state of various conditions monitored by your call center, such as the number of abandoned calls, the number of total answered calls, and the average waiting time.
Note: Your Key Performance Indicators (KPIs) are displayed under My Statistics.


