m (1 révision importée : Milengo test upload) |
m (1 révision importée) |
||
| Ligne 1 : | Ligne 1 : | ||
| − | = | + | =Add a widget= |
| − | |||
<onlyinclude> | <onlyinclude> | ||
| − | + | It's easy to add a new report widget to your Genesys Pulse dashboard or wallboard. Genesys Pulse provides a basic set of predefined report templates, complete with statistics that are typical for reporting activities handled by Genesys solutions. Any users with the appropriate privileges can create or modify widgets and report templates. | |
__TOC__ | __TOC__ | ||
{{CloudStep_Stack | {{CloudStep_Stack | ||
| − | |title= | + | |title=Add reports |
| − | |text= | + | |text=There are two ways you can add a report to your dashboard or wallboard: |
| − | * | + | * Click the more icon in the right corner and click '''Add a Widget'''. |
| − | * | + | * On empty dashboards and wallboards, click the '''Add a Widget''' icon. |
| − | + | Genesys Pulse opens a report builder to guide you. | |
| − | |||
|media1=PulseDashboard85105AddAWidgetAction.png}} | |media1=PulseDashboard85105AddAWidgetAction.png}} | ||
| Ligne 19 : | Ligne 17 : | ||
{{CloudStep_Stack | {{CloudStep_Stack | ||
| − | |title= | + | |title=Build a report |
| − | |text=Genesys Pulse | + | |text=Genesys Pulse guides you through the process of creating or changing report widgets. Click the [[RTRReports|standard report template]] you want to use and then click '''Create Widget'''. |
| − | |||
| − | |||
| − | + | Select the '''Objects''' and '''Statistics''' that you want to see in your report. | |
| − | |||
| − | |||
| − | |||
| − | + | Your report widget must have: | |
| + | * One or more objects to measure. Your widgets must contain fewer than 100 objects. | ||
| + | * Add at least one non-string statistic. | ||
| + | * One widget type with specific display options. | ||
| − | + | Click the '''Display Options''' tab to define how you want to display your report. | |
|media1=Pulse_85105_WidgetChooseTemplate.png | |media1=Pulse_85105_WidgetChooseTemplate.png | ||
| Ligne 37 : | Ligne 33 : | ||
{{CloudStep_Stack | {{CloudStep_Stack | ||
| − | |title= | + | |title=Display options |
| − | |text= | + | |text=You need to define the default display settings for your widget. Users can change these options on their own dashboard. |
| − | <ul><li> | + | <ul><li>Provide a name for report title.</li> |
| − | <li> | + | <li>Select from the available [[RTRWidgetTypes|Widget Types]] to display.</li> |
| − | <li> | + | <li>Select the Widget refresh rate. </li> |
| − | <li> | + | <li>Select options associated with the visualization (for example, alerts and size).</li> |
| − | <li> | + | <li>Optional: For templates configured to use changes-based statistics (CurrentStatus and ExtendedCurrentStatus), set '''enable quick updates'''. See [[Documentation:EZP:Deploy:Deploy#t-5 | Deploying RabbitMQ for Quick Widget Updates]].</li> |
| − | <li> | + | <li>If needed, select the '''Alerts for statistic''' and define the alert values (from 1 to 3).</li> |
| − | </ul>{{NoteFormat| | + | </ul>{{NoteFormat|Confirm your environment can handle the number of widgets and refresh rate you plan to use. A shorter refresh rate increases demands on the CPU, memory, disk, and network.}} |
|media1=Pulse_85105_WidgetDisplayOptions.png | |media1=Pulse_85105_WidgetDisplayOptions.png | ||
}} | }} | ||
| − | + | ==What do I do next?== | |
| − | + | You might want to learn more about: | |
| − | + | * [[RTRReports|Popular real-time reports]] | |
| − | * [[ | + | * [[RTRTemplates|Editing standard report templates]] |
| − | * [[ | + | * [[RTRWidgetTypes|Widget Types]] |
| − | * [[ | + | * [[RTRWidgetExternal|Displaying external content using an IFRAME widget]] |
| − | * [[ | + | * [[RTRStatProperties|Statistic properties]] |
| − | * [[ | + | * [[RTRFormulas|Report formulas]] |
| − | * [[ | ||
Version du juin 21, 2017 à 23:48
Add a widget
It's easy to add a new report widget to your Genesys Pulse dashboard or wallboard. Genesys Pulse provides a basic set of predefined report templates, complete with statistics that are typical for reporting activities handled by Genesys solutions. Any users with the appropriate privileges can create or modify widgets and report templates.
Sommaire
Add reports
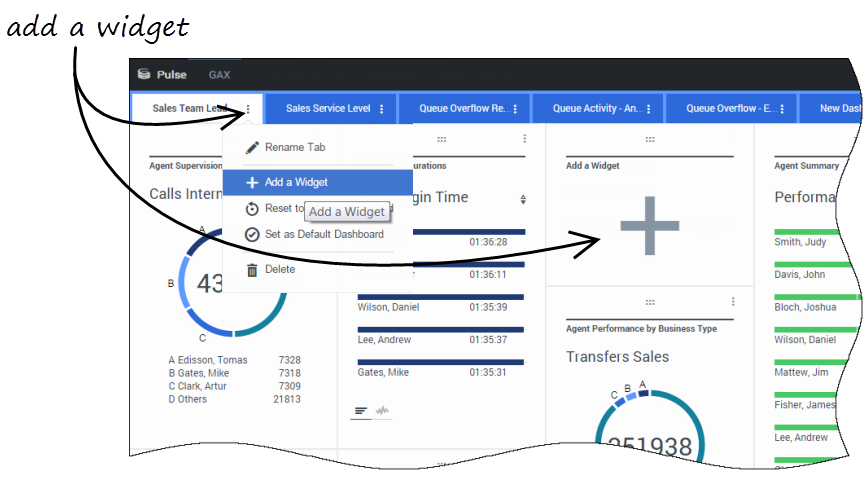
There are two ways you can add a report to your dashboard or wallboard:
- Click the more icon in the right corner and click Add a Widget.
- On empty dashboards and wallboards, click the Add a Widget icon.
Genesys Pulse opens a report builder to guide you.
Build a report
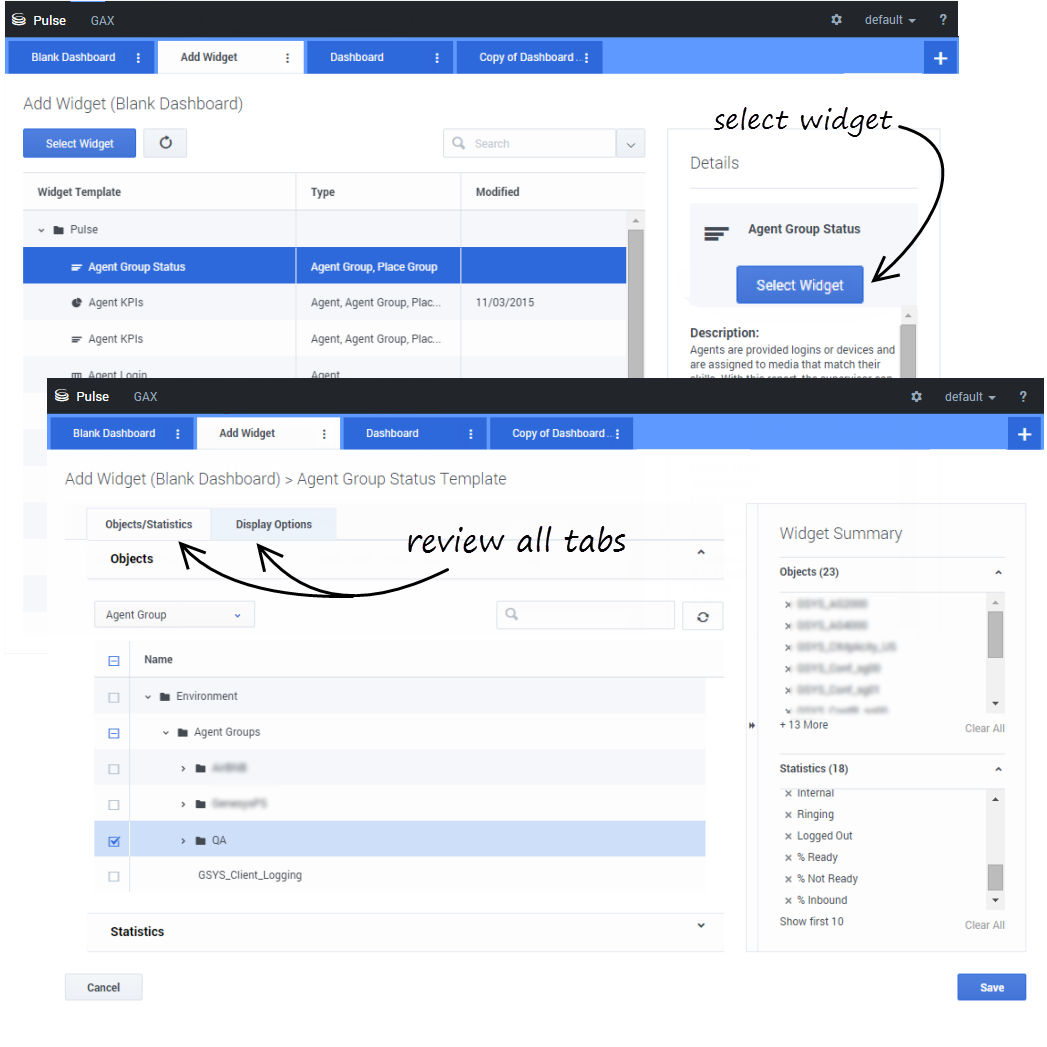
Genesys Pulse guides you through the process of creating or changing report widgets. Click the standard report template you want to use and then click Create Widget.
Select the Objects and Statistics that you want to see in your report.
Your report widget must have:
- One or more objects to measure. Your widgets must contain fewer than 100 objects.
- Add at least one non-string statistic.
- One widget type with specific display options.
Click the Display Options tab to define how you want to display your report.
Display options
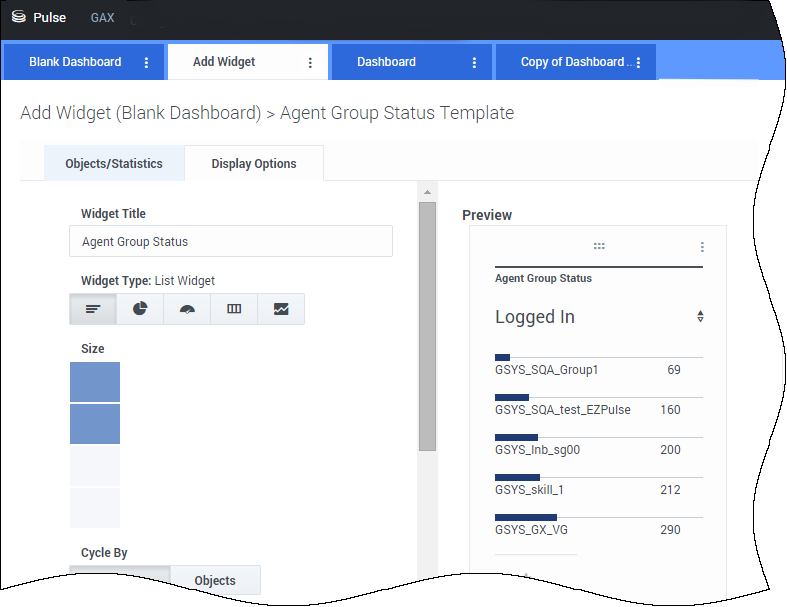
You need to define the default display settings for your widget. Users can change these options on their own dashboard.
- Provide a name for report title.
- Select from the available Widget Types to display.
- Select the Widget refresh rate.
- Select options associated with the visualization (for example, alerts and size).
- Optional: For templates configured to use changes-based statistics (CurrentStatus and ExtendedCurrentStatus), set enable quick updates. See Deploying RabbitMQ for Quick Widget Updates.
- If needed, select the Alerts for statistic and define the alert values (from 1 to 3).
What do I do next?
You might want to learn more about:


