m (1 révision importée) |
m (1 révision importée) |
||
| Ligne 1 : | Ligne 1 : | ||
| − | = | + | = Reports= |
| − | |||
<onlyinclude> | <onlyinclude> | ||
__NOTOC__ | __NOTOC__ | ||
{{BEC_Head | {{BEC_Head | ||
|context= | |context= | ||
| − | + | This topic describes how to use the the '''My Reports''' and '''Contact Center''' dashboards. These dashboards track your personal statistics and the statistics of your Contact Center. Your administrator might have added other reports too. | |
|dimension= | |dimension= | ||
}} | }} | ||
| − | {{NoteFormat| | + | {{NoteFormat|The videos and images in this Help document might show some features that are not yet available in this release of Agent Desktop.|3}} |
__TOC__ | __TOC__ | ||
{{AnchorDiv|stats}} | {{AnchorDiv|stats}} | ||
{{CloudStep_Stack | {{CloudStep_Stack | ||
| − | |title= | + | |title=How do I view my statistics? |
| − | |text= | + | |text=The '''My Statistics''' tab displays the list of your Key Performance Indicators (KPIs). |
| − | + | You can see your current KPIs and a summary of the KPIs of your work groups. You can use the results to compare your performance with the overall performance of the groups you belong to. | |
|textwide= | |textwide= | ||
| − | + | You might see the following performance-related icons in your list: | |
| − | * [[Image:IW_KPI_Warning_Icon.gif|link=]] | + | * [[Image:IW_KPI_Warning_Icon.gif|link=]] indicates a ''warning''. |
| − | * [[Image:IW_KPI_Alert_Icon.gif|link=]] | + | * [[Image:IW_KPI_Alert_Icon.gif|link=]] indicates an ''error''. |
| − | * [[File:Worst.png|link=]] | + | * [[File:Worst.png|link=]] indicates ''worst''. |
| − | ( | + | (Check with your system administrator to find out what the icons mean and how they impact your statistics.) |
| − | ''' | + | '''Note:''' If a statistic has been configured incorrectly, the background of the statistic becomes red and the error icon is displayed. You should report errors immediately. The reason for the problem is displayed in a tooltip if you place your mouse pointer over the problematic statistic row. |
| − | {{NoteFormat| | + | {{NoteFormat|If you are using Agent Desktop in Accessibility Mode a Refresh button is displayed in the My Statistics tab.|2}} |
|media1=wwe_my_statistics.png | |media1=wwe_my_statistics.png | ||
}} | }} | ||
{{AnchorDiv|statscc}} | {{AnchorDiv|statscc}} | ||
{{CloudStep_Stack | {{CloudStep_Stack | ||
| − | |title= | + | |title=How do I view statistics for my Contact Center? |
| − | |text= | + | |text=The list of statistics about the Routing Points, Virtual Queues, Queue Groups, and Agent Groups is displayed under '''Contact Center Statistics'''. |
| − | + | You can see statistics that summarize the state of various conditions monitored by your call center, such as the number of abandoned calls, the number of total answered calls, and the average waiting time. | |
| − | ''' | + | '''Note:''' Your Key Performance Indicators (KPIs) are displayed under '''My Statistics'''. |
|textwide= | |textwide= | ||
| − | {{NoteFormat| | + | {{NoteFormat|If you are using Agent Desktop in Accessibility Mode a Refresh button is displayed in the My Contact Center tab.|2}} |
|media1=WWE_Contact_Center_Statistics_Overview_852.png | |media1=WWE_Contact_Center_Statistics_Overview_852.png | ||
}} | }} | ||
Version du décembre 6, 2018 à 18:49
Reports
This topic describes how to use the the My Reports and Contact Center dashboards. These dashboards track your personal statistics and the statistics of your Contact Center. Your administrator might have added other reports too.
Sommaire
How do I view my statistics?
The My Statistics tab displays the list of your Key Performance Indicators (KPIs).
You can see your current KPIs and a summary of the KPIs of your work groups. You can use the results to compare your performance with the overall performance of the groups you belong to.
 indicates a warning.
 indicates an error.
 indicates worst.
(Check with your system administrator to find out what the icons mean and how they impact your statistics.)
Note: If a statistic has been configured incorrectly, the background of the statistic becomes red and the error icon is displayed. You should report errors immediately. The reason for the problem is displayed in a tooltip if you place your mouse pointer over the problematic statistic row.
How do I view statistics for my Contact Center?
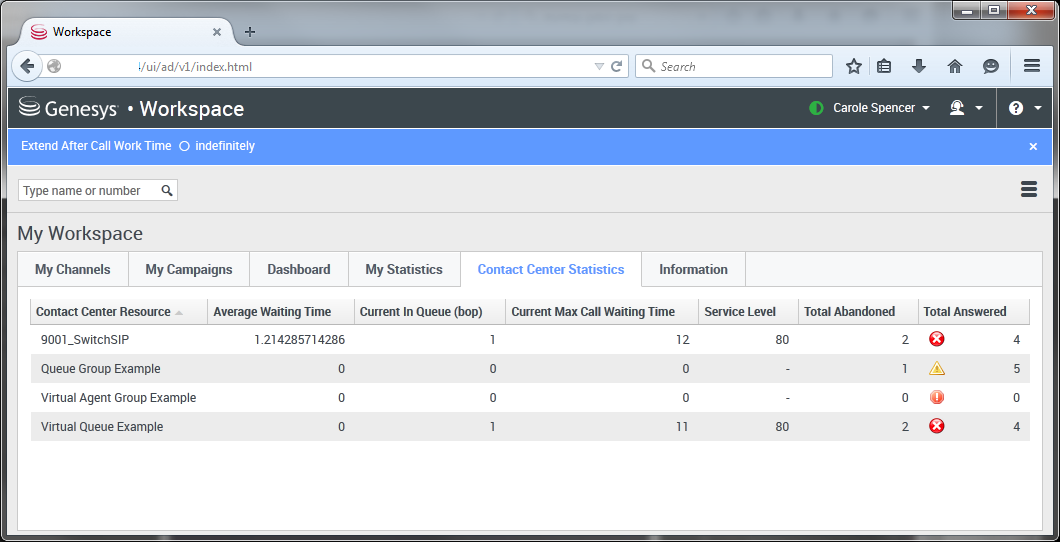
The list of statistics about the Routing Points, Virtual Queues, Queue Groups, and Agent Groups is displayed under Contact Center Statistics.
You can see statistics that summarize the state of various conditions monitored by your call center, such as the number of abandoned calls, the number of total answered calls, and the average waiting time.
Note: Your Key Performance Indicators (KPIs) are displayed under My Statistics.


