
m (1 révision importée : Milengo test upload) |
m (1 révision importée) |
||
| Ligne 1 : | Ligne 1 : | ||
| − | = | + | =Getting started= |
| − | + | Genesys Pulse is your gateway for monitoring your contact center, so you can better meet your business needs. | |
| − | Genesys Pulse | ||
| − | {{NoteFormat| | + | {{NoteFormat|What you see in Genesys Pulse depends on your contact center and your role within it, so you might not be able to do or see all the things covered in this help. If you think you should be able to do or see something you can't, check with your supervisor or system administrator.}} |
| − | + | Now that you know what Genesys Pulse is, you’re probably wondering how to use it. This Getting Started page will get you running, viewing, and managing reports. Let’s get started. | |
{{CloudStep_Stack | {{CloudStep_Stack | ||
| − | |title= | + | |title=Access reports |
| − | |text= | + | |text=You can open the Genesys Pulse dashboard within Genesys Administrator Extension (GAX) to see the real-time reports. |
| − | + | Reports are displayed in widgets, which can easily be expanded to dashboard size to display additional detail. | |
|media1=Pulse85105OpenDashboard.png}} | |media1=Pulse85105OpenDashboard.png}} | ||
{{CloudStep_Stack | {{CloudStep_Stack | ||
| − | |title= | + | |title=Manage dashboards and wallboards |
| − | |text= | + | |text=Use tabs to manage [[RTRUserAccess|Genesys Pulse dashboards and wallboards]]. Click the more icon in the right corner of the dashboard for options: |
| − | *''' | + | *'''Add a Widget'''—Add a new widget to the dashboard or wallboard. |
| − | *''' | + | *'''Clone'''—Create a new copy of the dashboard or wallboard. |
| − | *''' | + | *'''Close'''—Close the dashboard or wallboard. |
| − | *''' | + | *'''Customize'''—Change the name, description and other options of the dashboard or wallboard. |
| − | *''' | + | *'''Launch'''—Launch a wallboard. |
| − | *''' | + | *'''Publish'''—Share the unpublished dashboard or wallboard. |
| − | *''' | + | *'''Save As'''—Save a new copy of the published dashboard or wallboard. |
| − | *''' | + | *'''Update Shared Copy'''—Overwrite the published copy of the dashboard or wallboard. |
|media1=Pulse85105DashMoreIcon.png}} | |media1=Pulse85105DashMoreIcon.png}} | ||
{{CloudStep_Stack | {{CloudStep_Stack | ||
| − | |title= | + | |title=Use report widgets |
| − | |text= | + | |text=[[RTRWidgets|Genesys Pulse widgets]] display Donut, Data, Key Performance Indicator (KPI), Time Tracking, or List charts of key statistics for objects on your dashboard. |
| + | |||
| + | You can | ||
| + | *'''Clone'''—Create a copy of the widget. | ||
| + | *'''Delete'''—Delete the widget. | ||
| + | *'''Download'''—Download the report data as a CSV file. | ||
| + | *'''Edit'''—Make changes to the widget. | ||
| + | *'''Expand to Tab'''—See an expanded, detailed view of the report. | ||
| − | + | You can also [[RTRWidgets|add new widgets to your dashboard]]. | |
| − | |||
| − | |||
| − | |||
| − | |||
| − | |||
| − | |||
| − | |||
|media1=Pulse85105WidgetActions.png}} | |media1=Pulse85105WidgetActions.png}} | ||
{{CloudStep_Stack | {{CloudStep_Stack | ||
| − | |title= | + | |title=Expand reports to dashboard |
| − | |text= | + | |text=Click the more icon in the top right corner of a widget and select '''Expand to Tab''' to see a detailed view of your report. This expanded report opens within a new tab, so it won't impact your initial dashboard. |
| − | + | You can | |
<ul> | <ul> | ||
| − | <li> | + | <li>Download the report data as a CSV file by selecting '''Download Widget''' from the the more menu. </li> |
| − | <li> | + | <li>Make changes to the source widget by selecting '''Edit''' from the the more menu. </li> |
| − | <li> | + | <li>Change the number of columns you want to display on a grid by clicking the pencil icon.</li> |
| − | <li> | + | <li>Sort options, define objects, and define statistics. </li> |
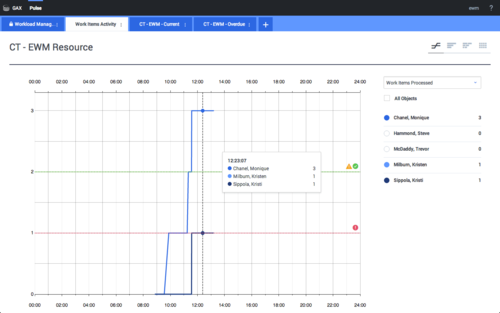
| − | <li> | + | <li> View different chart types available in the expanded widget: |
<ul><li> | <ul><li> | ||
| − | <p><toggledisplay linkstyle font-size:larger showtext="[+] | + | <p><toggledisplay linkstyle font-size:larger showtext="[+] Time Tracking" hidetext="[-] Time Tracking"> |
<p>[[File:PulseDonutExpanded185104.png|center|500px|link=]]</p> | <p>[[File:PulseDonutExpanded185104.png|center|500px|link=]]</p> | ||
</toggledisplay></p></li> | </toggledisplay></p></li> | ||
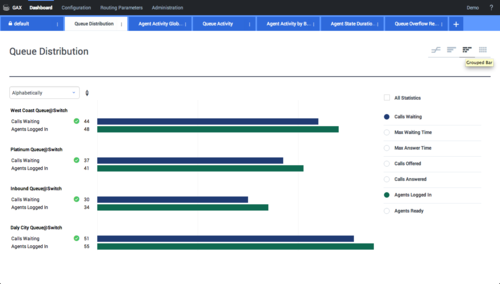
| − | <li><p><toggledisplay linkstyle font-size:larger showtext="[+] | + | <li><p><toggledisplay linkstyle font-size:larger showtext="[+] Grouped Bar" hidetext="[-] Grouped Bar"> |
<p>[[File:PulseDonutGroupedBar85104.png|center|500px|link=]]</p> | <p>[[File:PulseDonutGroupedBar85104.png|center|500px|link=]]</p> | ||
</toggledisplay></p></li> | </toggledisplay></p></li> | ||
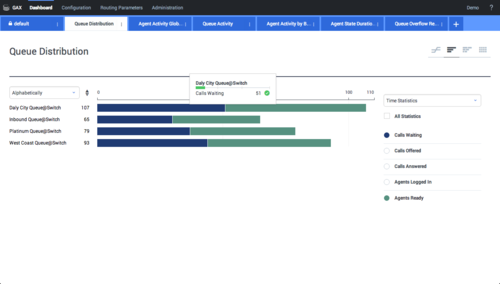
| − | <li><p><toggledisplay linkstyle font-size:larger showtext="[+] | + | <li><p><toggledisplay linkstyle font-size:larger showtext="[+] Stacked Bar" hidetext="[-] Stacked Bar"> |
<p>[[File:PulseDonutStackedBar85104.png|center|500px|link=]]</p> | <p>[[File:PulseDonutStackedBar85104.png|center|500px|link=]]</p> | ||
</toggledisplay></p></li> | </toggledisplay></p></li> | ||
<li> | <li> | ||
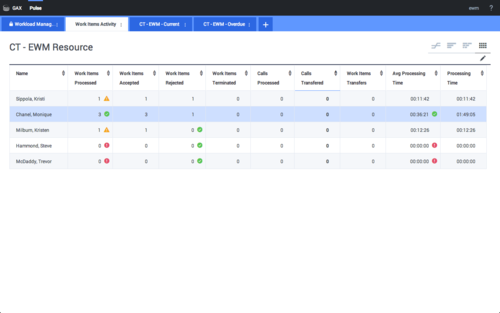
| − | <p><toggledisplay linkstyle font-size:larger showtext="[+] | + | <p><toggledisplay linkstyle font-size:larger showtext="[+] Data" hidetext="[-] Data"> |
<p>[[File:PulseDonutGrid85104.png|center|500px|link=]]</p> | <p>[[File:PulseDonutGrid85104.png|center|500px|link=]]</p> | ||
</toggledisplay></p></li></ul> | </toggledisplay></p></li></ul> | ||
| Ligne 75 : | Ligne 74 : | ||
}} | }} | ||
| − | + | ==What do I do next?== | |
| − | + | You might want to learn more about: | |
| − | + | * [[RTRUserAccess|Manage dashboards and wallboards]] | |
| − | * [[RTRUserAccess| | + | * [[RTRDashboardExample|Dashboard and wallboard examples]] |
| − | * [[RTRDashboardExample| | + | * [[RTRWidgets|Add report widgets]] |
| − | * [[RTRWidgets| | + | * [[RTRReports|Popular real-time reports]] |
| − | * [[RTRReports| | + | * [[RTRWidgetExternal|Display external content using an IFRAME widget]] |
| − | * [[RTRWidgetExternal| | ||
[[Category:V:EZP:DRAFT]] | [[Category:V:EZP:DRAFT]] | ||
Version du juin 21, 2017 à 23:48
Sommaire
Getting started
Genesys Pulse is your gateway for monitoring your contact center, so you can better meet your business needs.
Now that you know what Genesys Pulse is, you’re probably wondering how to use it. This Getting Started page will get you running, viewing, and managing reports. Let’s get started.
Access reports

You can open the Genesys Pulse dashboard within Genesys Administrator Extension (GAX) to see the real-time reports.
Reports are displayed in widgets, which can easily be expanded to dashboard size to display additional detail.
Manage dashboards and wallboards

Use tabs to manage Genesys Pulse dashboards and wallboards. Click the more icon in the right corner of the dashboard for options:
- Add a Widget—Add a new widget to the dashboard or wallboard.
- Clone—Create a new copy of the dashboard or wallboard.
- Close—Close the dashboard or wallboard.
- Customize—Change the name, description and other options of the dashboard or wallboard.
- Launch—Launch a wallboard.
- Publish—Share the unpublished dashboard or wallboard.
- Save As—Save a new copy of the published dashboard or wallboard.
- Update Shared Copy—Overwrite the published copy of the dashboard or wallboard.
Use report widgets

Genesys Pulse widgets display Donut, Data, Key Performance Indicator (KPI), Time Tracking, or List charts of key statistics for objects on your dashboard.
You can
- Clone—Create a copy of the widget.
- Delete—Delete the widget.
- Download—Download the report data as a CSV file.
- Edit—Make changes to the widget.
- Expand to Tab—See an expanded, detailed view of the report.
You can also add new widgets to your dashboard.
Expand reports to dashboard

Click the more icon in the top right corner of a widget and select Expand to Tab to see a detailed view of your report. This expanded report opens within a new tab, so it won't impact your initial dashboard.
You can
- Download the report data as a CSV file by selecting Download Widget from the the more menu.
- Make changes to the source widget by selecting Edit from the the more menu.
- Change the number of columns you want to display on a grid by clicking the pencil icon.
- Sort options, define objects, and define statistics.
- View different chart types available in the expanded widget:
What do I do next?
You might want to learn more about: