(Update with the copy of version: 8.5.1draft) |
m (1 révision importée) |
||
| Ligne 1 : | Ligne 1 : | ||
| − | = | + | =Genesys Pulse Help= |
| − | |||
<onlyinclude> | <onlyinclude> | ||
| − | Genesys Pulse | + | Genesys Pulse is a widget-based performance dashboard solution for monitoring contact center resources in real time. |
| − | {{NoteFormat| | + | {{NoteFormat|You cannot use compatibility mode in Internet Explorer, even if you are using a supported version.}} |
__NOTOC__ | __NOTOC__ | ||
{{CloudStep_Stack | {{CloudStep_Stack | ||
|title= | |title= | ||
| − | |text= | + | |text=You can |
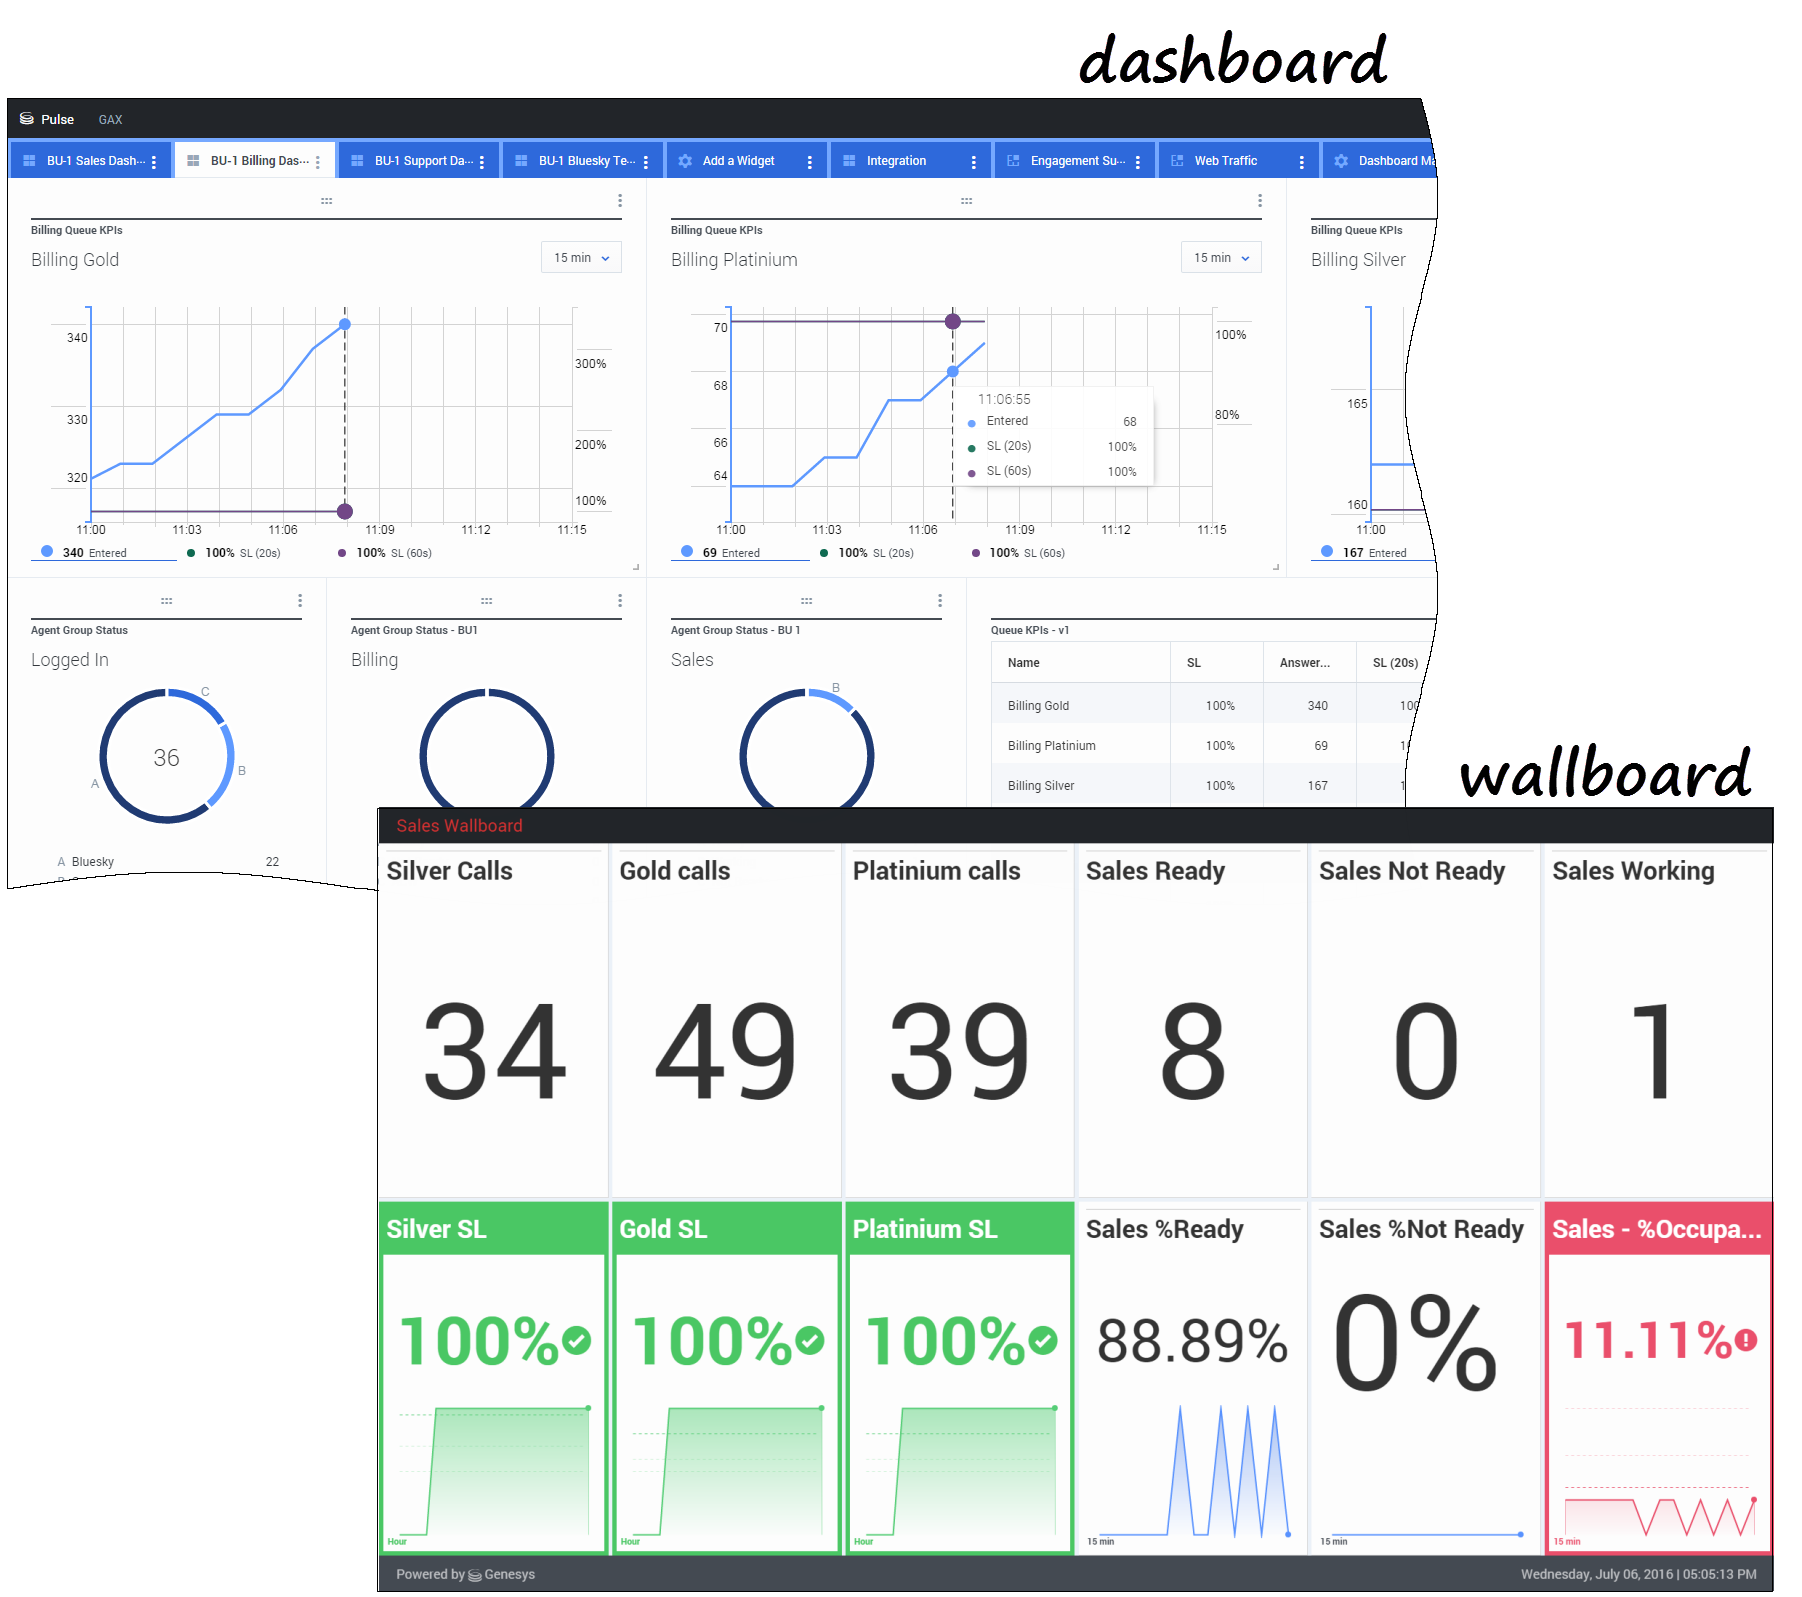
| − | * | + | * create [[RTRUserAccess|dashboards or wallboards]] to monitor agents, agent groups, queues, and more. |
| − | * | + | * customize [[RTRWidgets|report widgets]] to display user-defined Donut, Grid, Key Performance Indicator (KPI), or List charts. |
| − | * | + | * use [[RTRTemplates|widget templates]] to quickly create report widgets for your dashboard. |
| − | + | Ready? [[RTRQuickStart|Get started]]. | |
| − | + | Looking for answers to specific questions? Try these topics: | |
| − | *[[RTRReports| | + | *[[RTRReports|Popular real-time reports]] |
| − | * [[RTRUserAccess| | + | * [[RTRUserAccess|Manage dashboards and wallboards]] |
| − | * [[RTRDashboardExample| | + | * [[RTRDashboardExample|Dashboard and wallboard examples]] |
| − | *[[RTRWidgets| | + | *[[RTRWidgets|Add reports to your dashboard or wallboard]] |
| − | *[[RTRWidgetExternal| | + | *[[RTRWidgetExternal|Display external content]] |
| − | *[[RTRStatProperties| | + | *[[RTRStatProperties|Statistic properties]] |
| − | *[[RTRTemplatesA| | + | *[[RTRTemplatesA|Report templates and statistics details]] |
|media1=Pulse85105IntroDashboard.png | |media1=Pulse85105IntroDashboard.png | ||
}} | }} | ||
| − | + | ==New to Pulse== | |
| − | + | Your version of Pulse might not include all the new functionality covered in this guide: | |
| − | + | * Wallboards are now available. | |
| − | * | + | * List of [[RTRTemplatesA|report templates included]] in Pulse. |
| − | * | ||
__NOTOC__ | __NOTOC__ | ||
Version du août 2, 2018 à 20:04
Genesys Pulse Help
Genesys Pulse is a widget-based performance dashboard solution for monitoring contact center resources in real time.
Important
You cannot use compatibility mode in Internet Explorer, even if you are using a supported version.
You can
- create dashboards or wallboards to monitor agents, agent groups, queues, and more.
- customize report widgets to display user-defined Donut, Grid, Key Performance Indicator (KPI), or List charts.
- use widget templates to quickly create report widgets for your dashboard.
Ready? Get started.
Looking for answers to specific questions? Try these topics:
New to Pulse
Your version of Pulse might not include all the new functionality covered in this guide:
- Wallboards are now available.
- List of report templates included in Pulse.
Comments or questions about this documentation? Contact us for support!

